

Android Studio offers a rich palette of built-in development tools and an even more abundant plugin ecosystem. The first three articles in this series focused on installation and setup and coding and running a simple mobile app with Android Studio. Now you'll get acquainted with some of the more advanced tools: three built-in tools and three plugins for debugging and improving the quality and productivity of your Android application code.
This article introduces the following tools for Android Studio:
- Logcat
- Debug
- Lint
Plugins for developer productivity
- ADB Idea
- Codota
- Lombok Plugin
Logging and debugging Android apps
A buggy app is a sure way to drive away potential customers. Logcat and Debug are two tools that come built-in to Android Studio, which you can use to identify and fix bugs in your Android code.
Logging Android: Logcat
You might not need or want a full-blown debugger for every "buggy" scenario. In some cases it's sufficient to log and correct the values of certain variables. Android Studio's Logcat is perfect for this task.
Logcat is a command-line tool (integrated into Android Debug Bridge -- ADB) that dumps a log of system messages that can help you find and fix problems in your code. Messages include stack traces for when the device throws an error, and log messages that you've purposefully embedded with the
android.util.Log class. Logcat is so useful it's been integrated directly into Android Studio, where you can access it from the View menu or the tool window bar.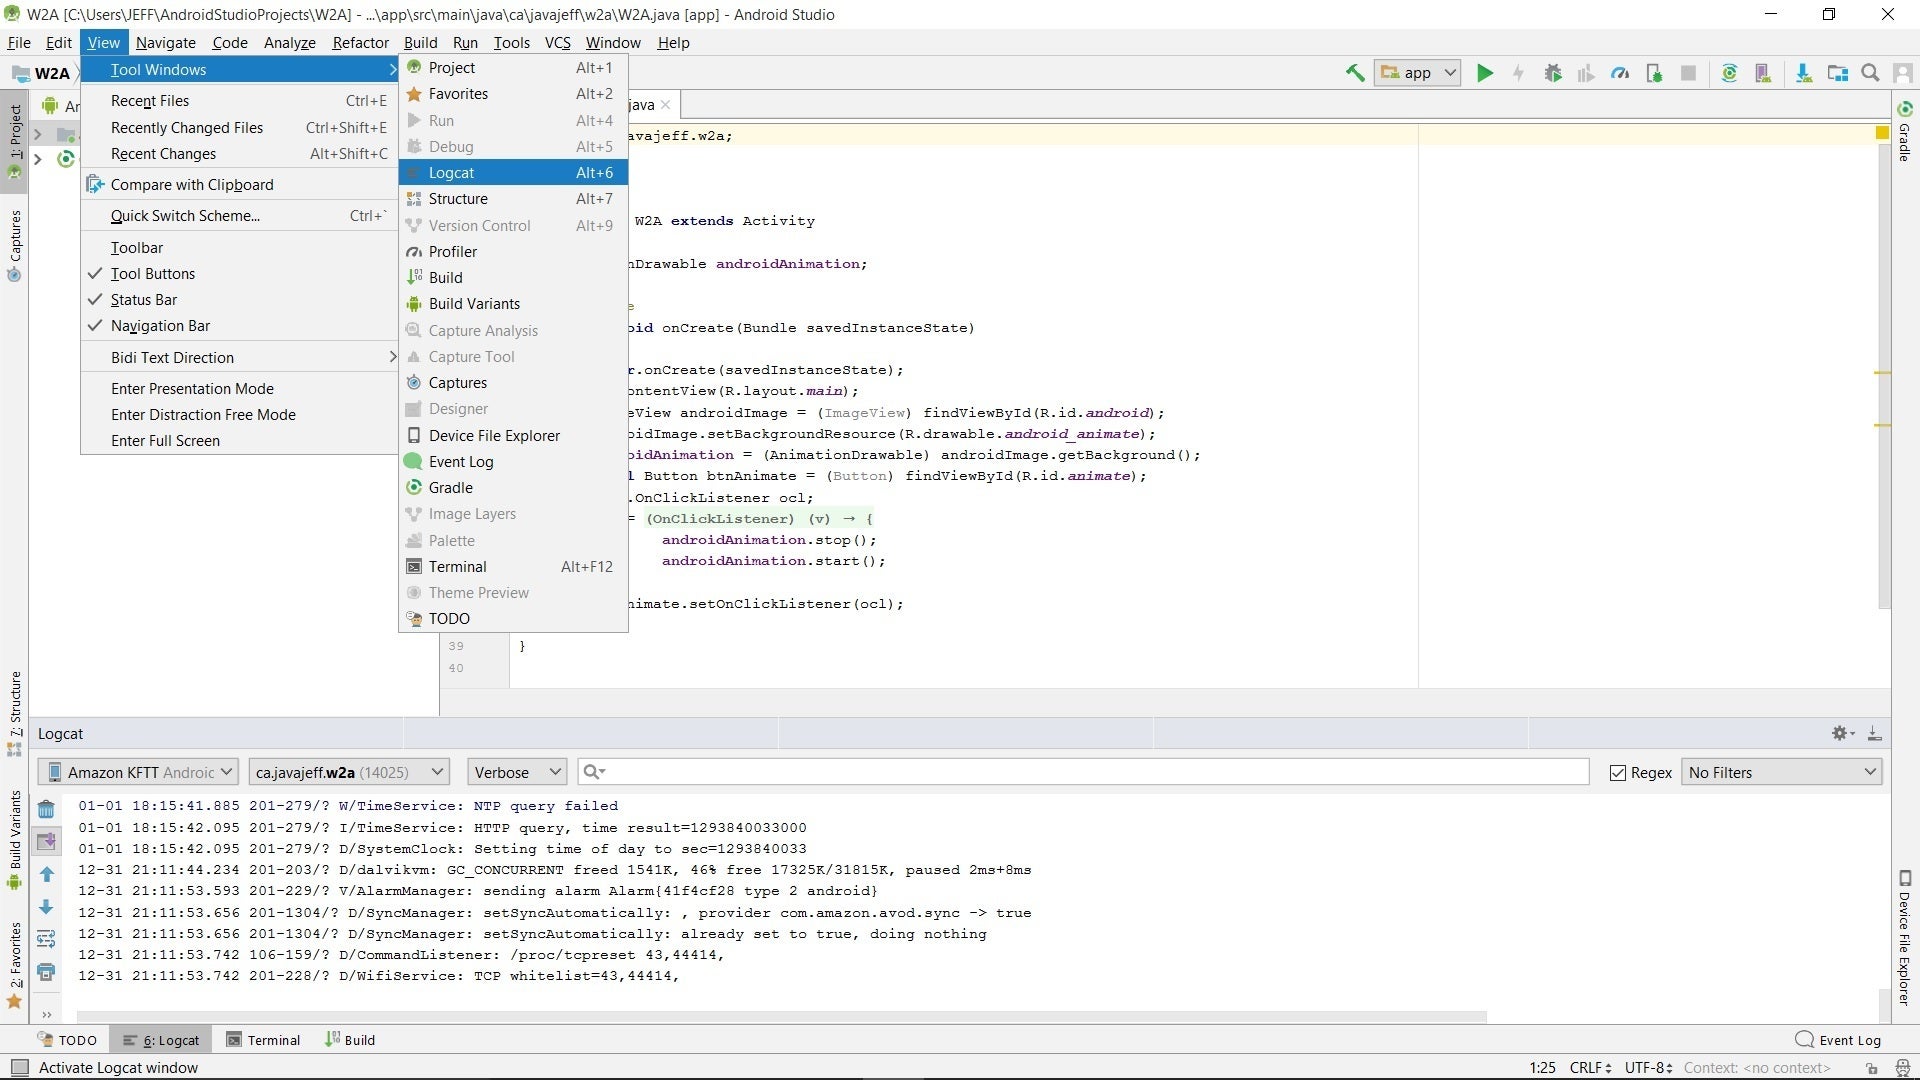
The Logcat window is divided into a horizontal row of drop-down lists and other controls followed by a message area. From left-to-right, the controls are:
- A drop-down list identifying connected devices and emulators. (See Figure 1.)
- A drop-down list identifying installed APK packages on the selected device.
- A drop-down list of logging levels:
- Verbose: show all messages.
- Debug: show debug log messages that are useful during development only, as well as the message levels lower in the drop-down list.
- Info: show expected log messages for regular usage, as well as the message levels lower in the drop-down list.
- Warn: show possible issues that are not yet errors, as well as the message levels lower in the drop-down list.
- Error: show issues that have caused errors -- thrown exceptions, as well as the Assert message level.
- Assert: show issues that the developer expects should never happen.
- A search bar where the only messages that appear are those containing the text you type in this control.
- A check box that lets you use regular expressions in the search bar. For example, in the context of Figure 1, you might specify SystemClock | AlarmManager (i.e., the message must contain either word).
- A drop-down list for filtering messages, including the following options:
- No Filters (the default) causes all messages for the selected device to appear, regardless of the selected APK package.
- Show only selected application presents only those messages for the selected APK package on the selected device, which are of the appropriate log level or lower.
- Edit Filter Configuration lets you create a custom filter.
In the source code, you can insert calls to various
android.util.Log methods to log messages. For example, you might call public static int i(String tag, String msg) to log an INFO-level message, or public static int w(String tag, String msg) to log a WARN-level message.
For either method, the string passed to
tag identifies the message's source (e.g., the method in which this logging method was called), and the string passed to msg identifies the message being logged.
Alternatively, you could call
System.out's and System.err's print() and println() methods. Calls to the System.out methods accomplish the same thing as log.i() calls; calls to the System.err methods accomplish the same thing as log.w() calls.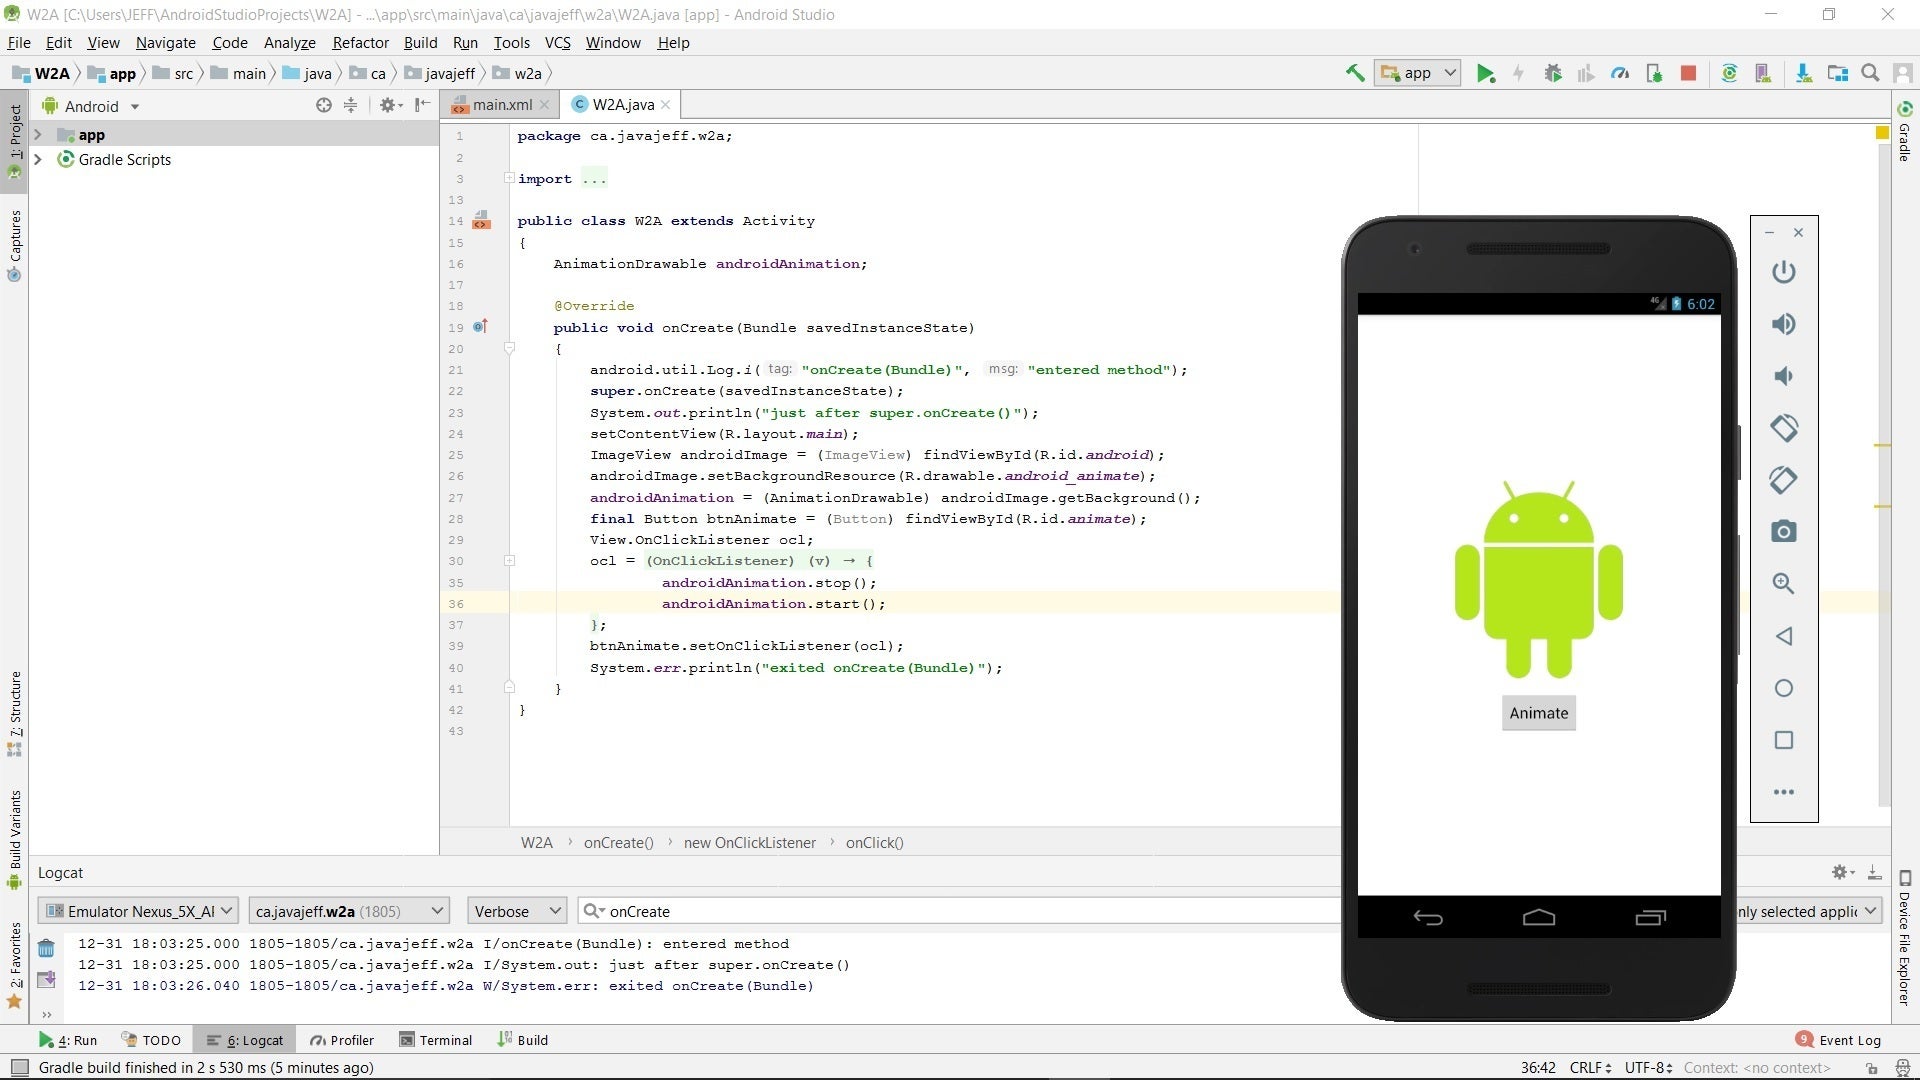
In Figure 2, the only displayed messages are for the example app process running on the emulated Nexus 5X device. Furthermore, these messages must contain
onCreate and be accepted by the Show only selected application filter.Debugging Android: Debug
Using Logcat to log and correct code is okay for very simple apps. For more complicated apps, this form of debugging can be tedious. Instead you'll want something that lets you debug the app's executable code. Android Studio's built-in Debug tool offers many capabilities, including the following:
- Select a device on which to debug your app.
- Set breakpoints in your application code (Java, Kotlin, or C/C++).
- Examine variables and evaluate expressions at runtime.
There are some prerequisites before using this debugging tool:
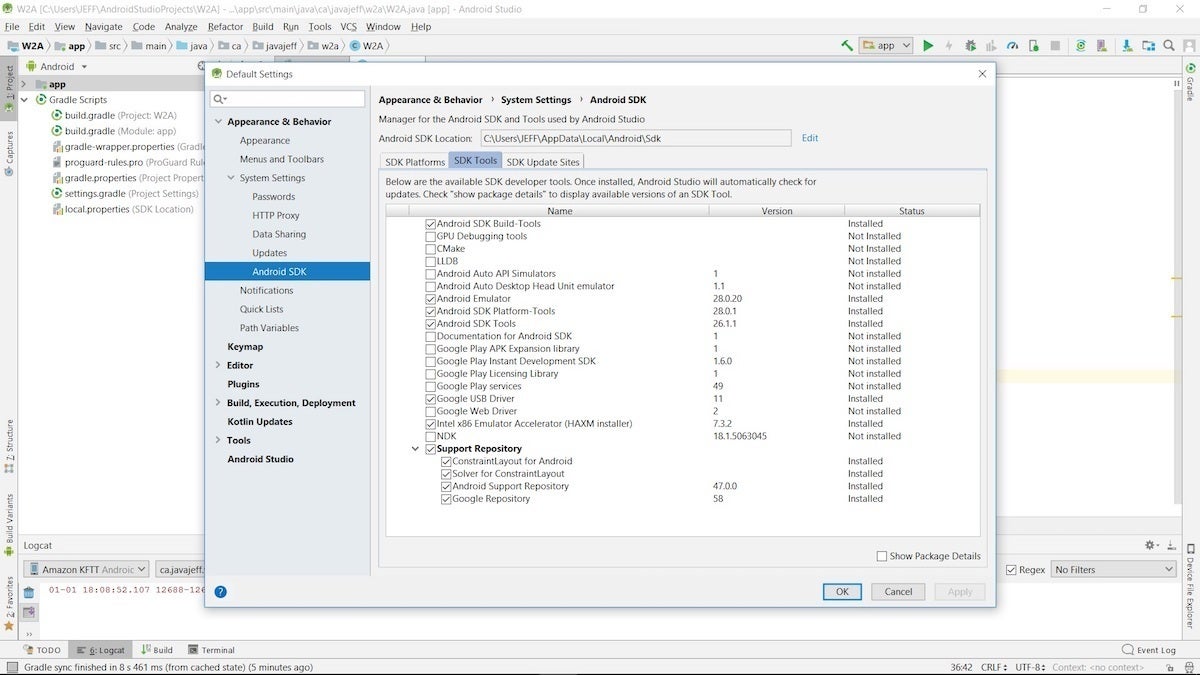
- If your app includes C/C++ source code, you'll need to install LLDB from the SDK Manager (see Figure 3). Fortunately, the example app for this series (W2A) doesn't contain C/C++ code, so we can ignore this prerequisite.
 Jeff Friesen
 - You must enable debugging on a connected device. However, if you're using an emulator (which we are for this example), you can ignore this prerequisite. Debugging is enabled by default on emulated devices.
- You must run a debuggable build variant. By default, this is created for you, so in many cases (including this example) you don't have to worry about it.
Let's run through a quick debugging session.
Simple Android debugging
Assuming you're running Android Studio with the editor window for the example app (W2A.java) open, your first step is to set a breakpoint on the
public void onCreate(Bundle savedInstanceState) line. Set the breakpoint by highlighting this line and doing one of the following:- Click the gutter area to the left of the line; the line should turn pink in response.
- Select Toggle Line Breakpoint from the Run menu.
- Press Ctrl and F8 simultaneously.
Now select Debug 'app' from the Run menu, or click the appropriate icon on the tool bar. If the emulator isn't running, you'll observe the Select Deployment Target dialog box. I selected Nexus 5X API 15 and clicked OK.
While you're waiting for the emulated device to come online, click the Debug button on the tool-window bar to display the Debug window. Eventually, you should see something similar to Figure 4.
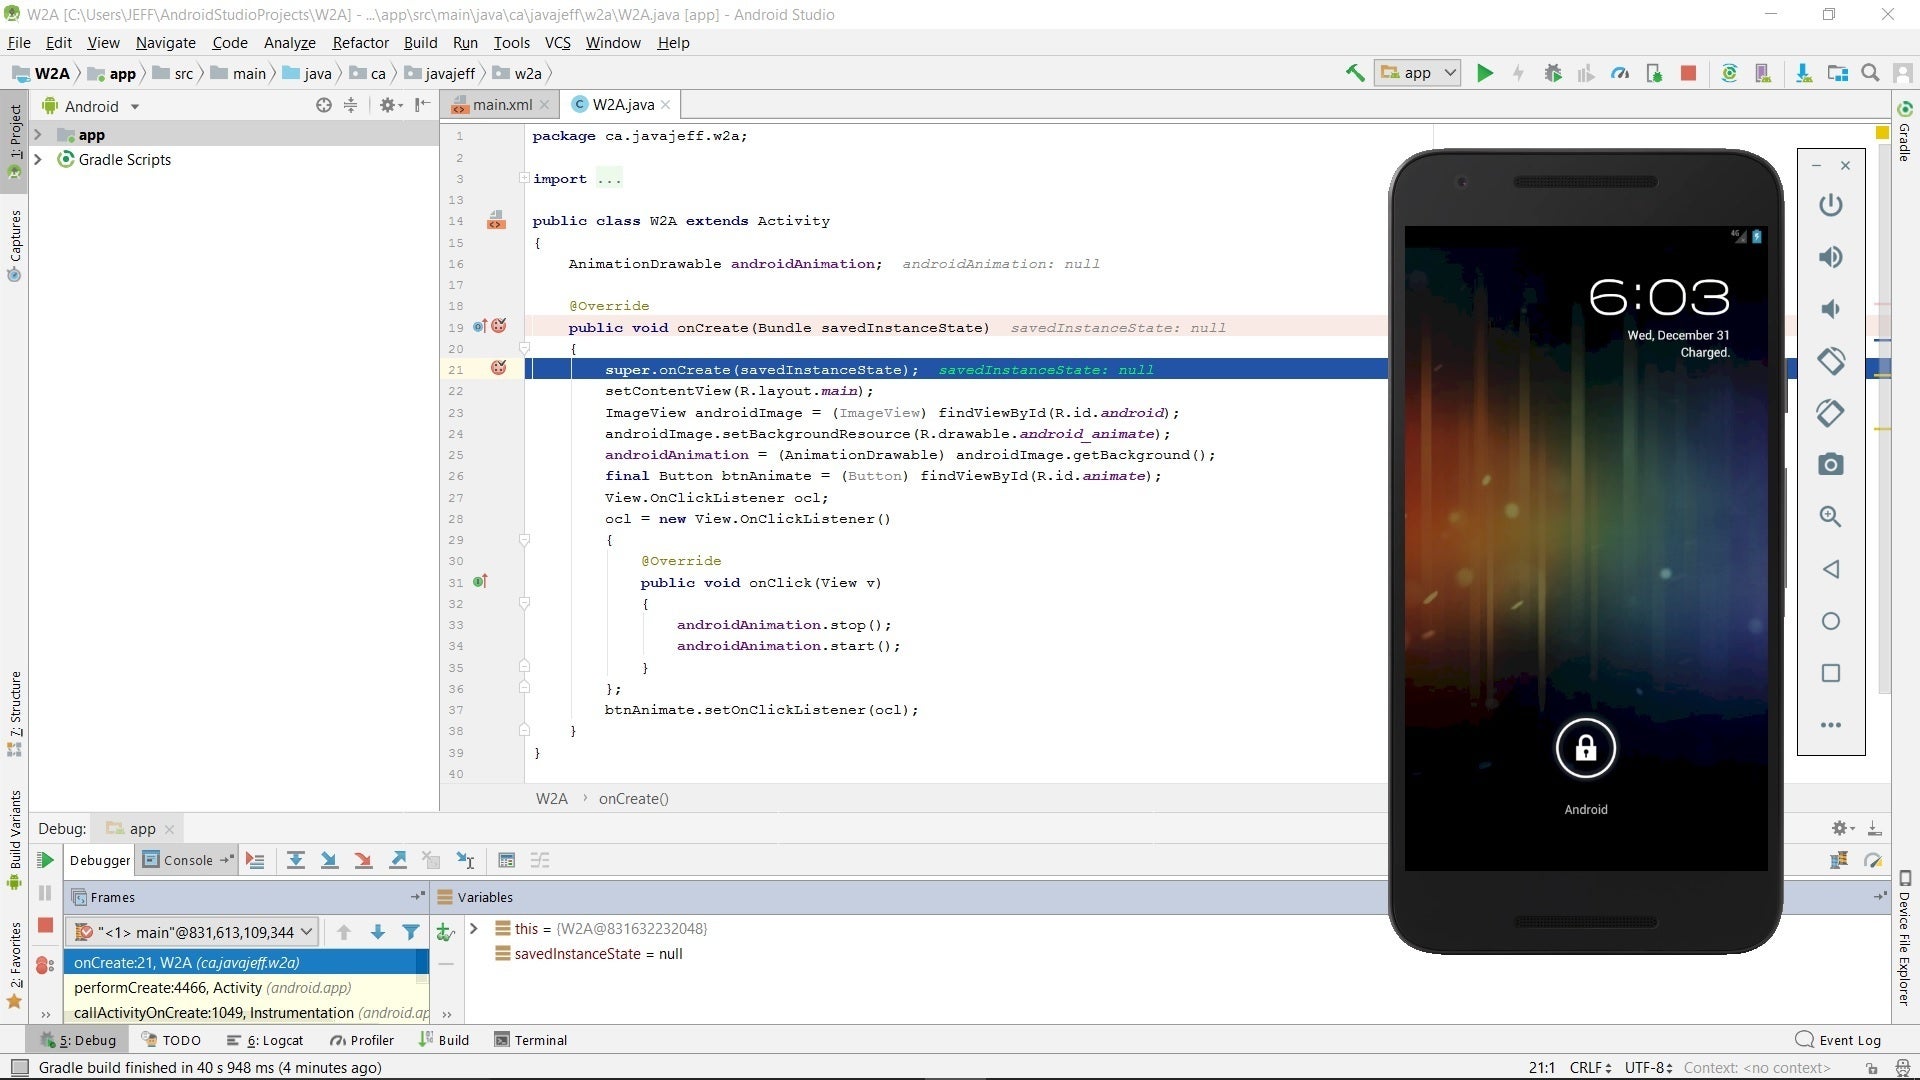
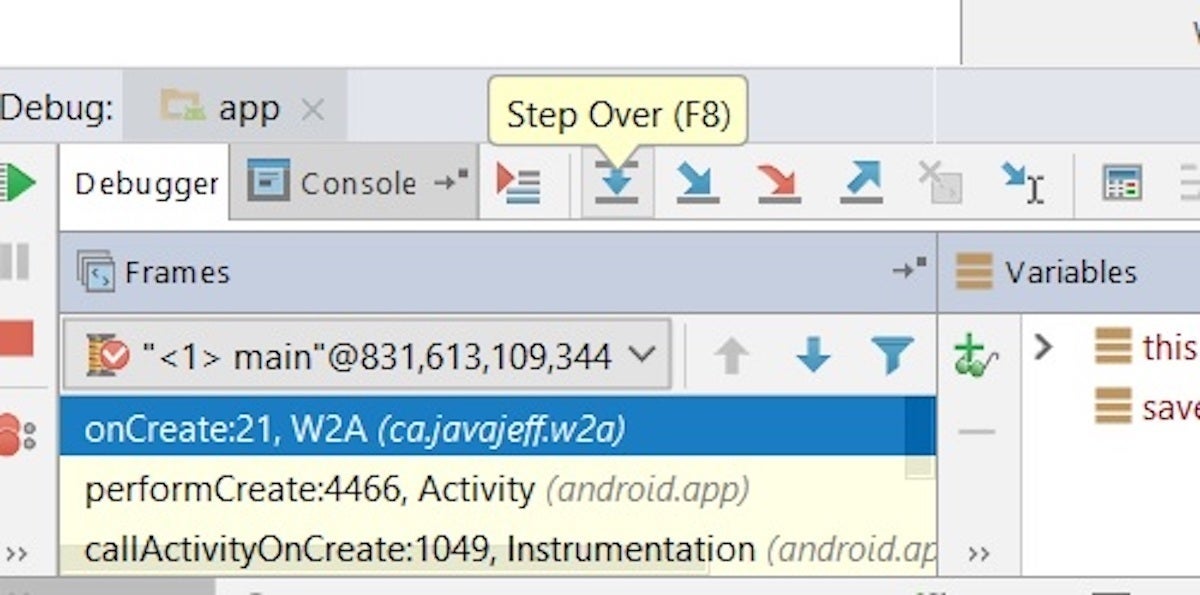
The Debug window provides icons for stepping over, into, and out of a method, and more. Figure 5 shows what happens when we step over a method.
 Jeff Friesen
Click the appropriate icon and select Step Over from the Run menu, or press F8. This lets us proceed deeper into the
onCreate() method while stepping over each method call.
Select the line with the closing
} character for the onCreate() method, then select Run to Cursor. You'll receive a notice that the application is running. After unlocking the device, you should see the example app's activity window.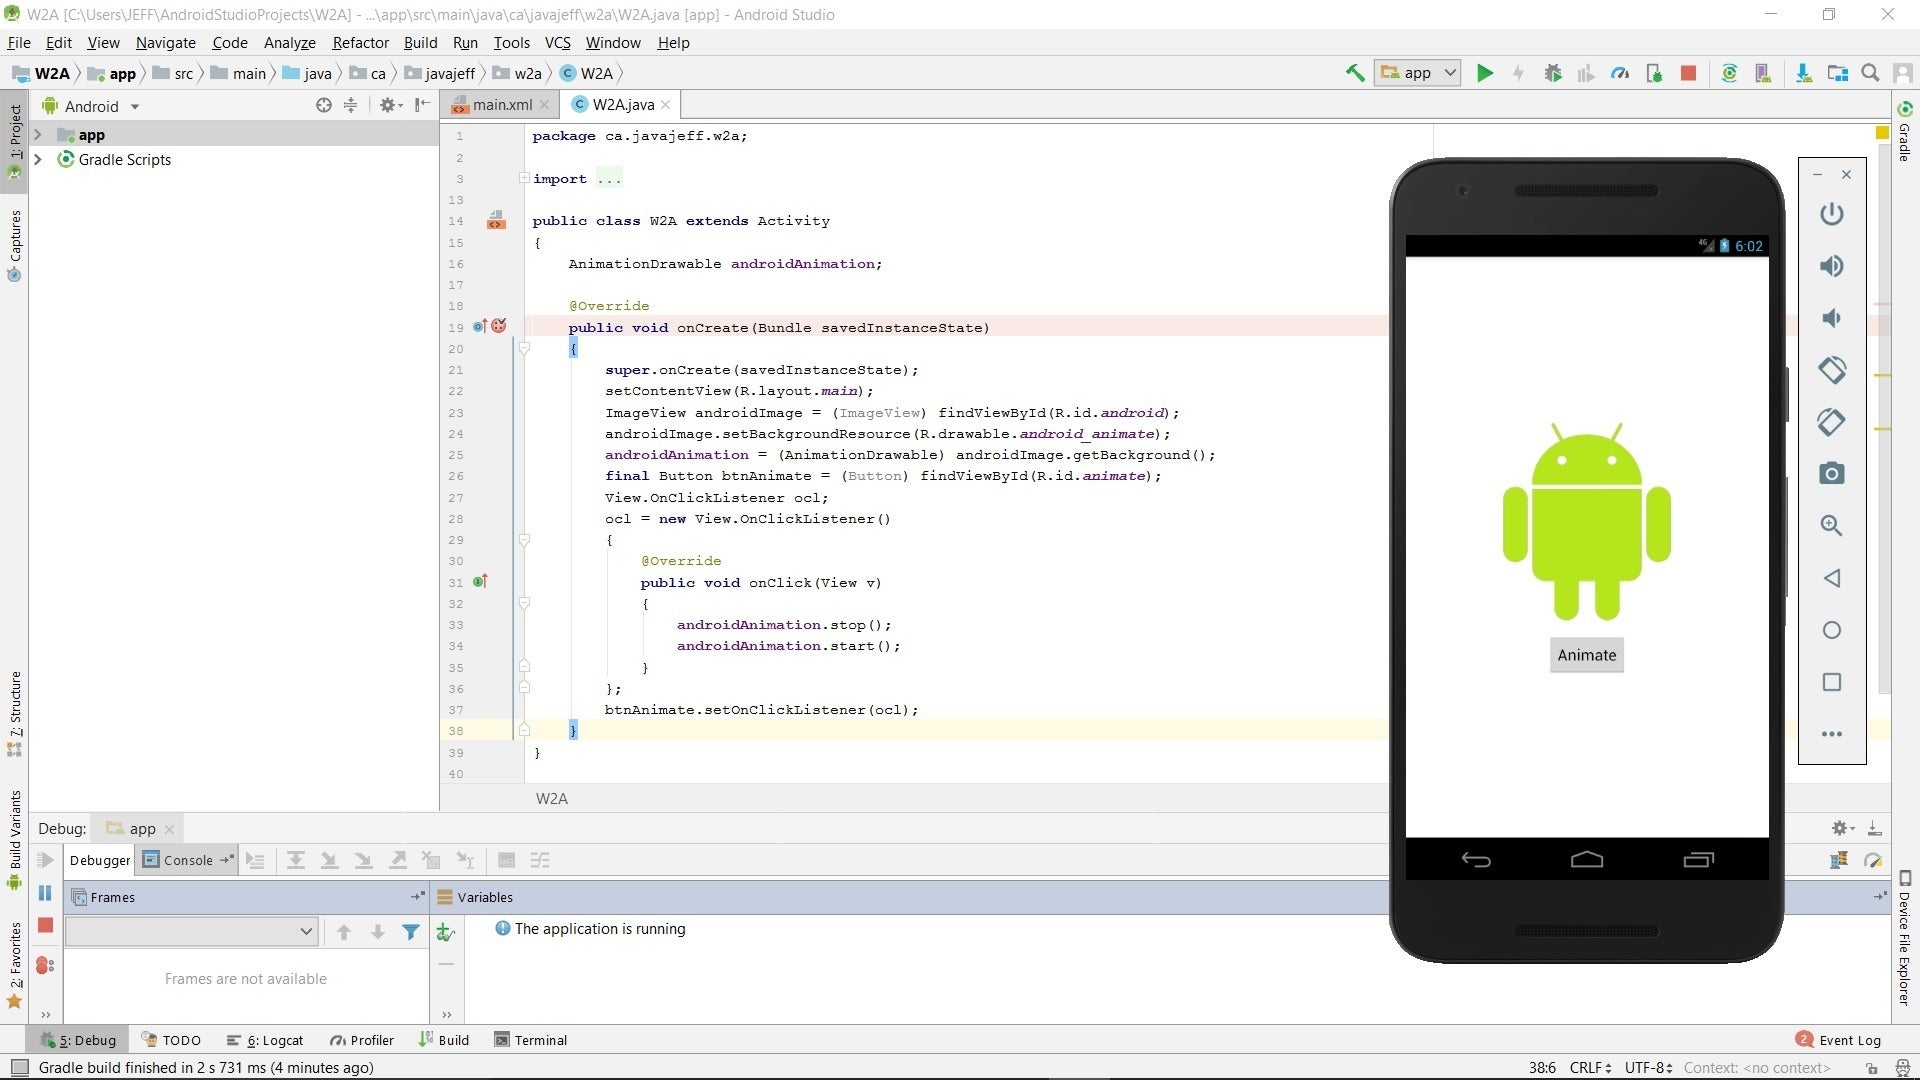
Code inspection with Lint
No matter how carefully you write it, your source code is likely to contain bugs, stylistic issues, and may reference resources that are inactive for one reason or another. A linter is a type of tool that scans source code for evidence of these and other bits of nasty fluff, which it reports to the developer.
Lint is a built-in linter for Android SDK. You can use it to locate issues such as deprecated elements and API calls that aren't supported by your target API.
To run Lint from within Android Studio, select Inspect Code... from the Analyze menu. Doing so activates the Specify Inspection Scope dialog box.
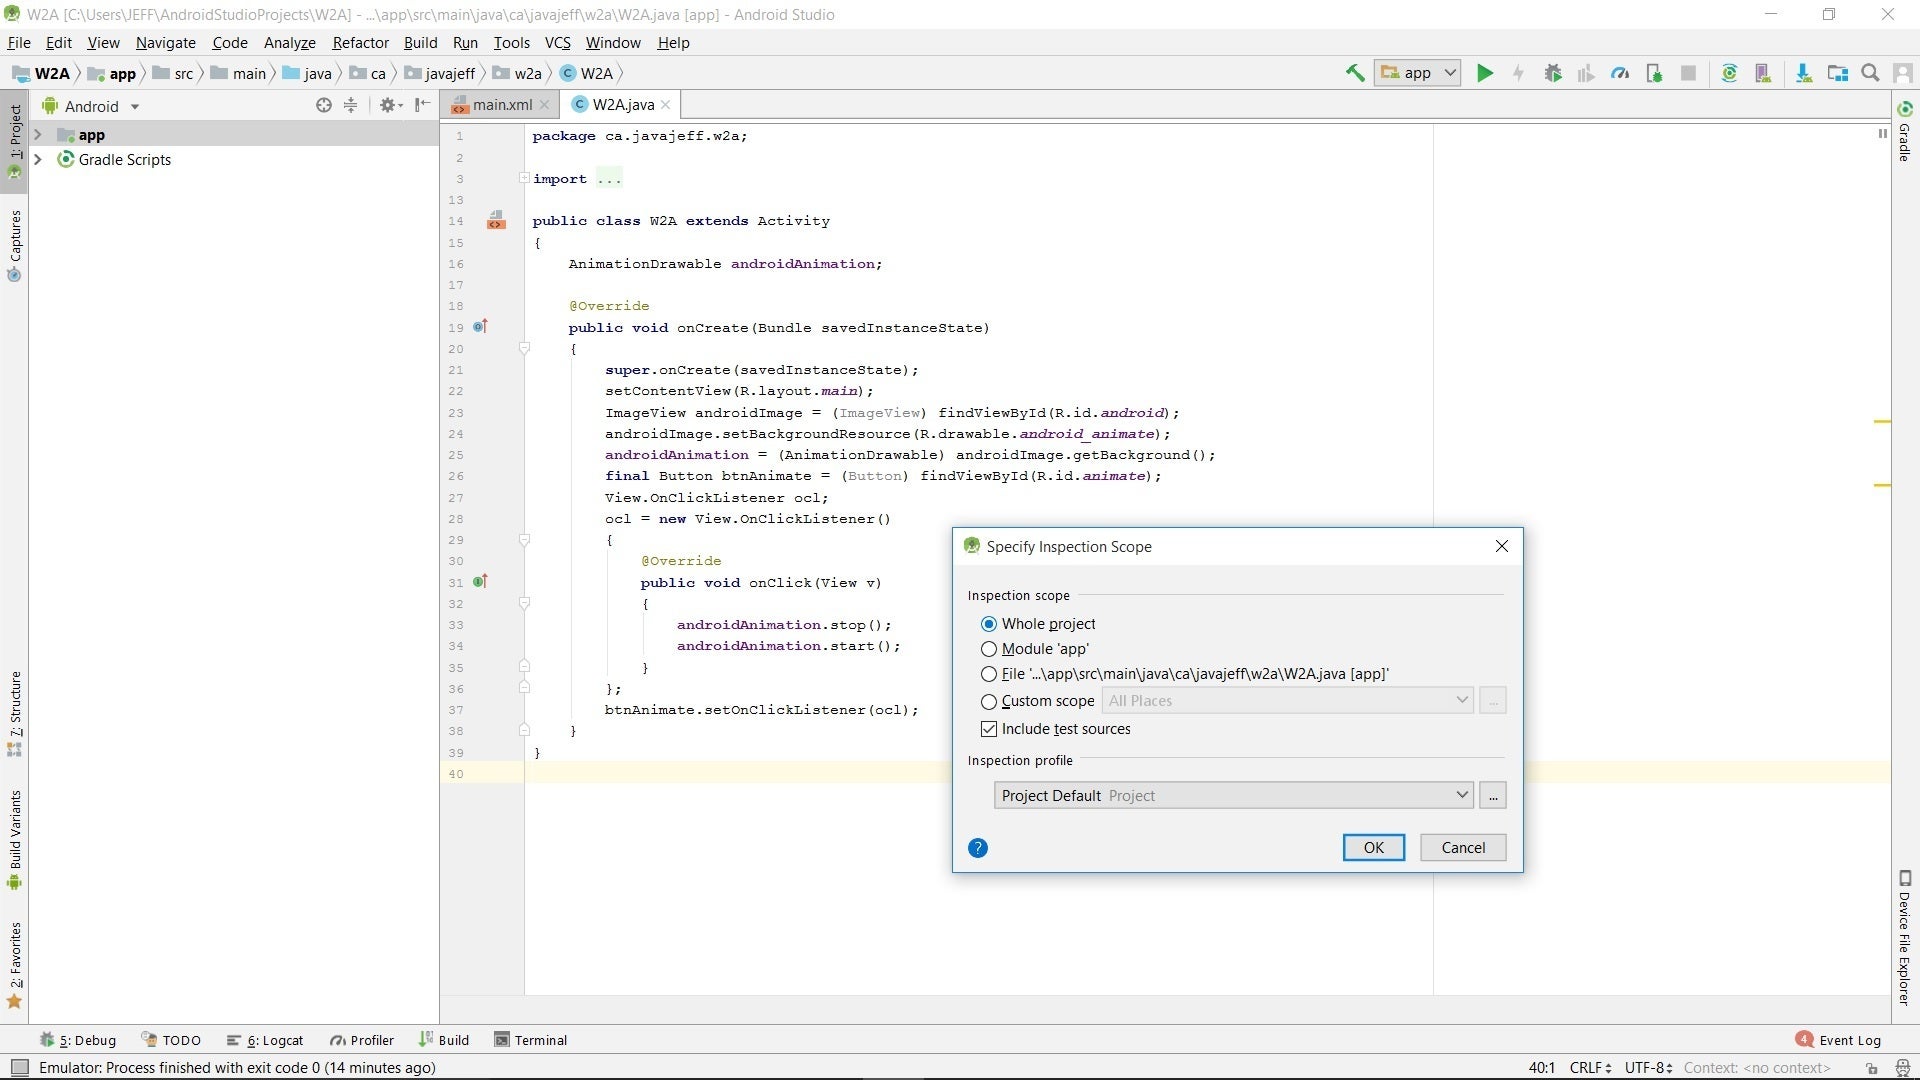
From the dialog box, select the desired scope (entire project, in this case), then click OK to begin the inspection. The results will appear in the Inspection Results window, where they're organized by category.
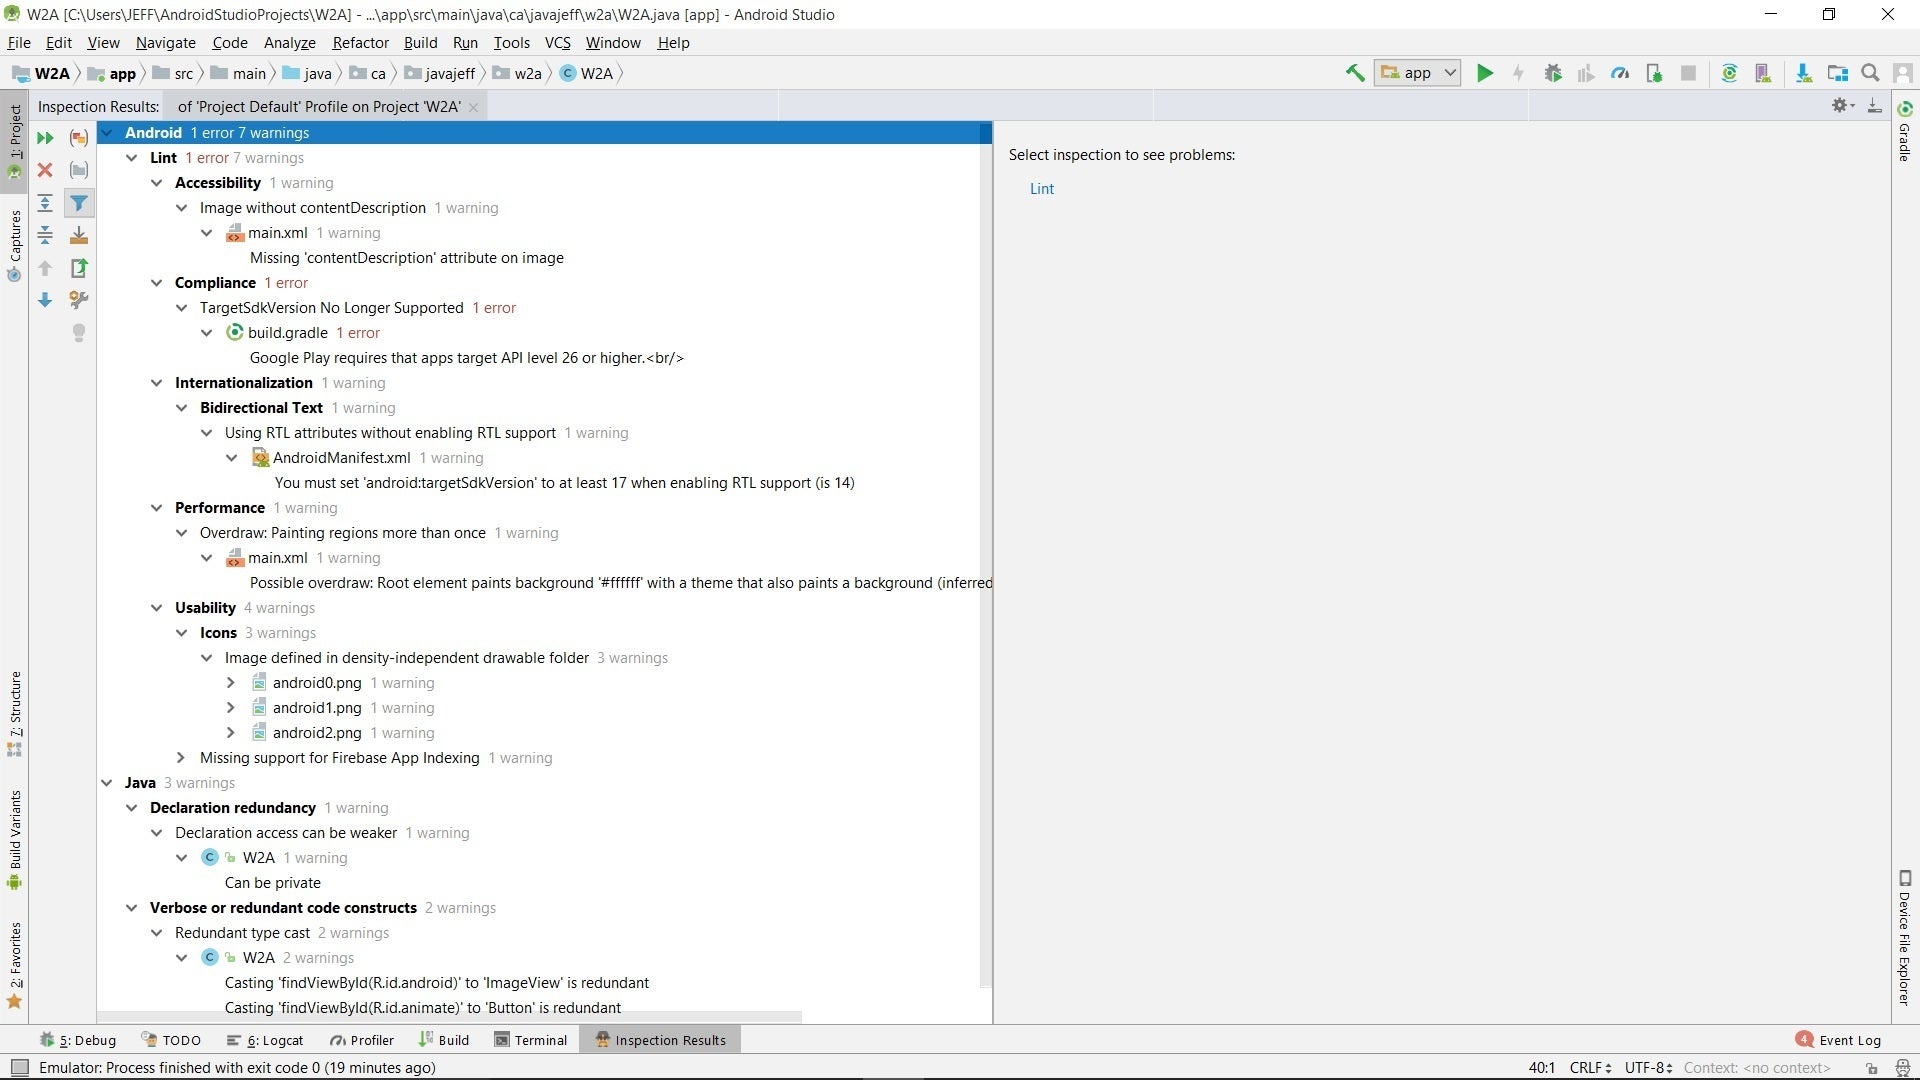
True to its nature, Lint has picked out a few pieces of fluff that could otherwise clutter the application code. Once spotted, it's easy to fix the three Java warnings shown in Figure 8: simply declare
androidAnimation private and remove the casts from the two findViewById() method calls.Installing and using Android Studio plugins
While built-in tools have their merit, many other tools are available as plugins. In this section, we'll look at three plugins for improving the productivity of your coding in Android Studio:
- ADB Idea
- Codota
- Lombok Plugin
Android Studio plugins manager
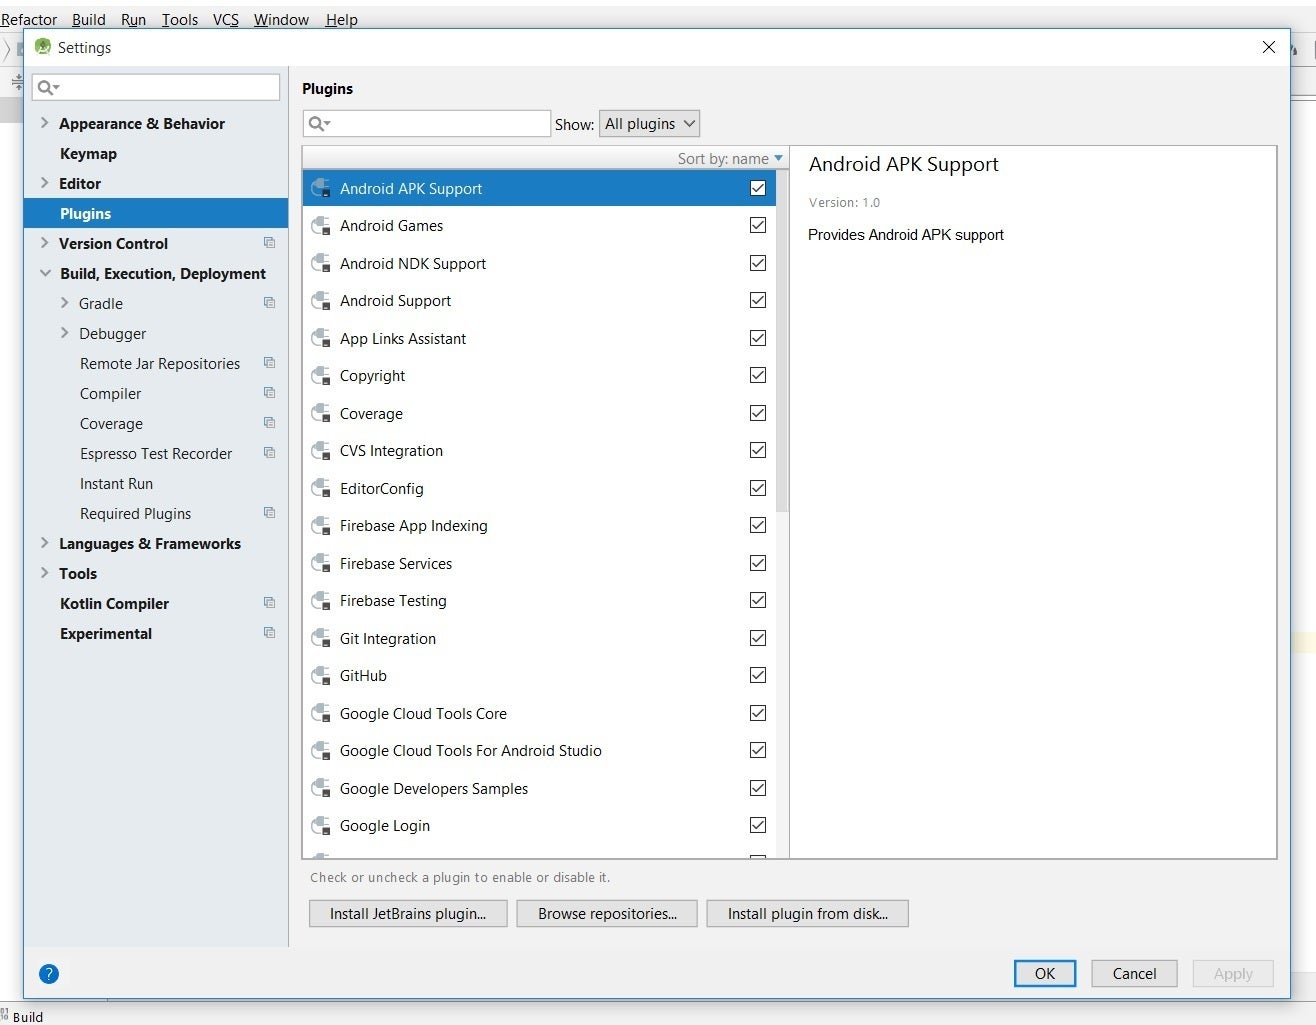
Android Studio's plugins manager makes it very easy to find and install plugins. Activate the plugins manager by selecting File > Settings followed by Plugins from the Settings dialog box:
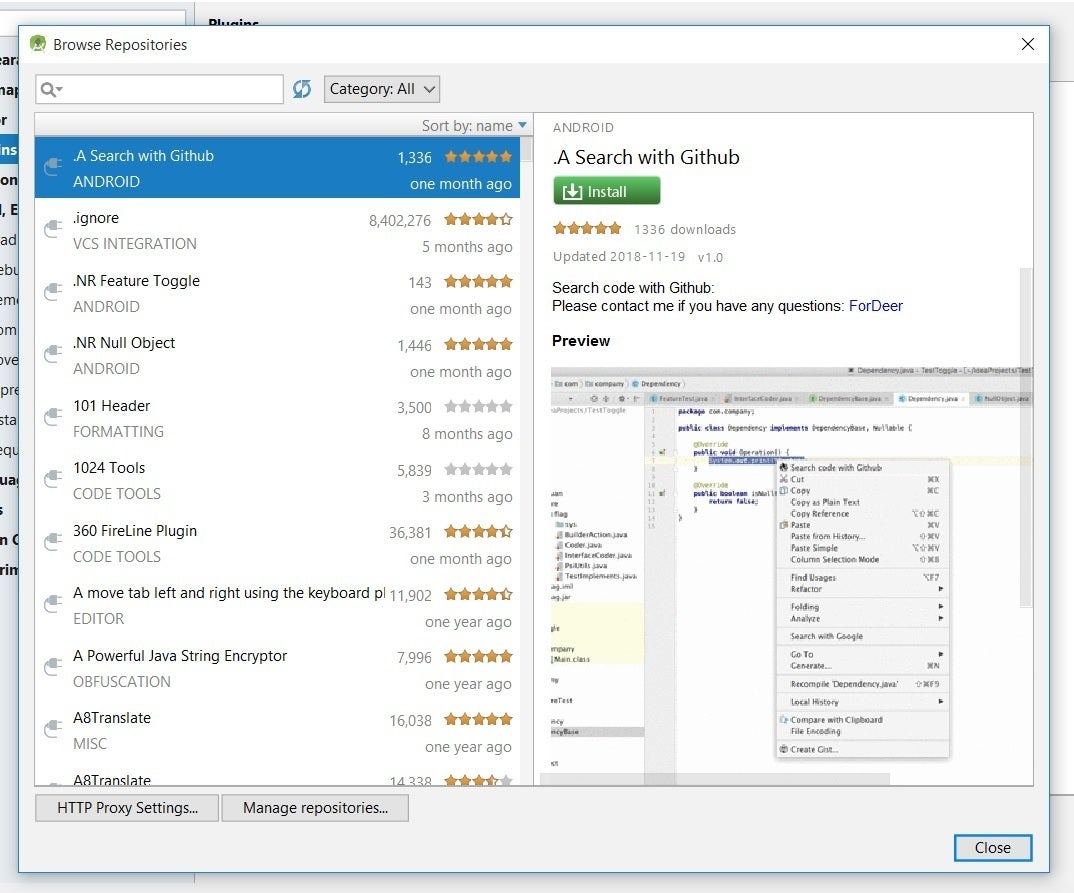
Next, click Browse repositories... to activate the Browse Repositories dialog box, which presents a full list of supported plugins. We'll use this dialog to select our first plugin, ADB Idea.
Boost your Android productivity
Code shortcuts: ADB Idea
ADB Idea speeds up day-to-day Android development by providing fast access to commonly used ADB commands, such as starting and uninstalling an app.
Select ADB Idea in the repository list of plugins, then click the Install button. Android Studio proceeds to download and install the plugin. It then relabels Install to Restart Android Studio. For each plugin, I had to reselect the plugin after clicking Restart Android Studio, and then click this button a second time in order to restart Android Studio.

Once installed, Android Studio lets you access ADB Idea from its Tools menu. Select Tools > ADB Idea and choose the appropriate command from the resulting pop-up menu.

After I selected ADB Restart App, I observed the following messages in the Event Log window as well as the restarted app on my Amazon Kindle device.
 Jeff Friesen
Find usable code: Codota
You can use the Codota plugin to access the Codota search engine, which lets you look through millions of publicly available Java source code snippets for solutions to Android coding problems.
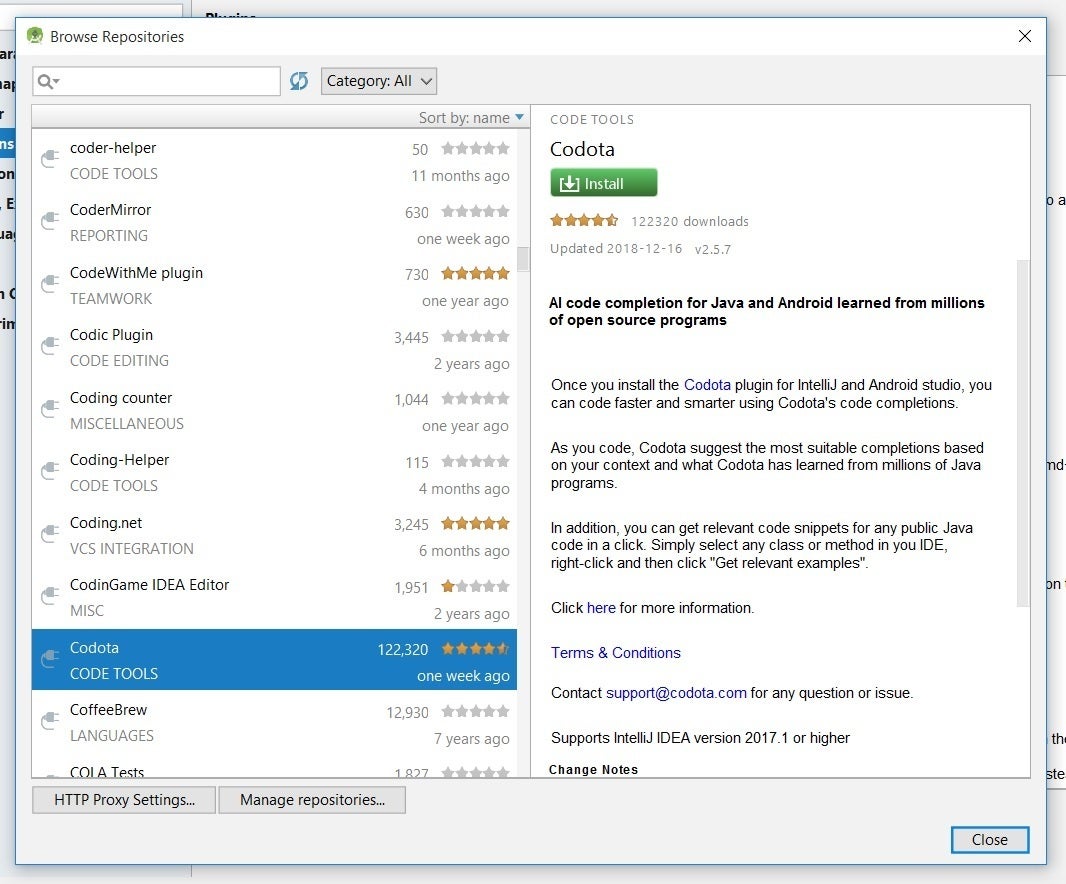
Select Codota in the repository list of plugins and then click the Install button. After Android Studio has downloaded and installed the plugin, it will re-label the Install button to Restart Android Studio. Restarting activates Codota.
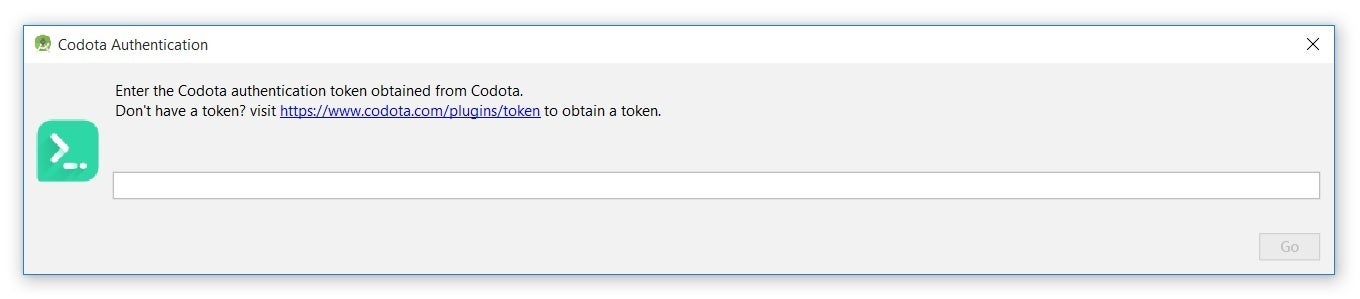
Upon restart, you'll encounter the Codota Authentication dialog box. Click the link and follow instructions to receive the token. Then, paste the token into the aforementioned dialog box and click Go.
Android Studio lets you access Codota by right-clicking on Java code in the editor window and selecting the Get relevant examples menu item, as shown in Figure 16.
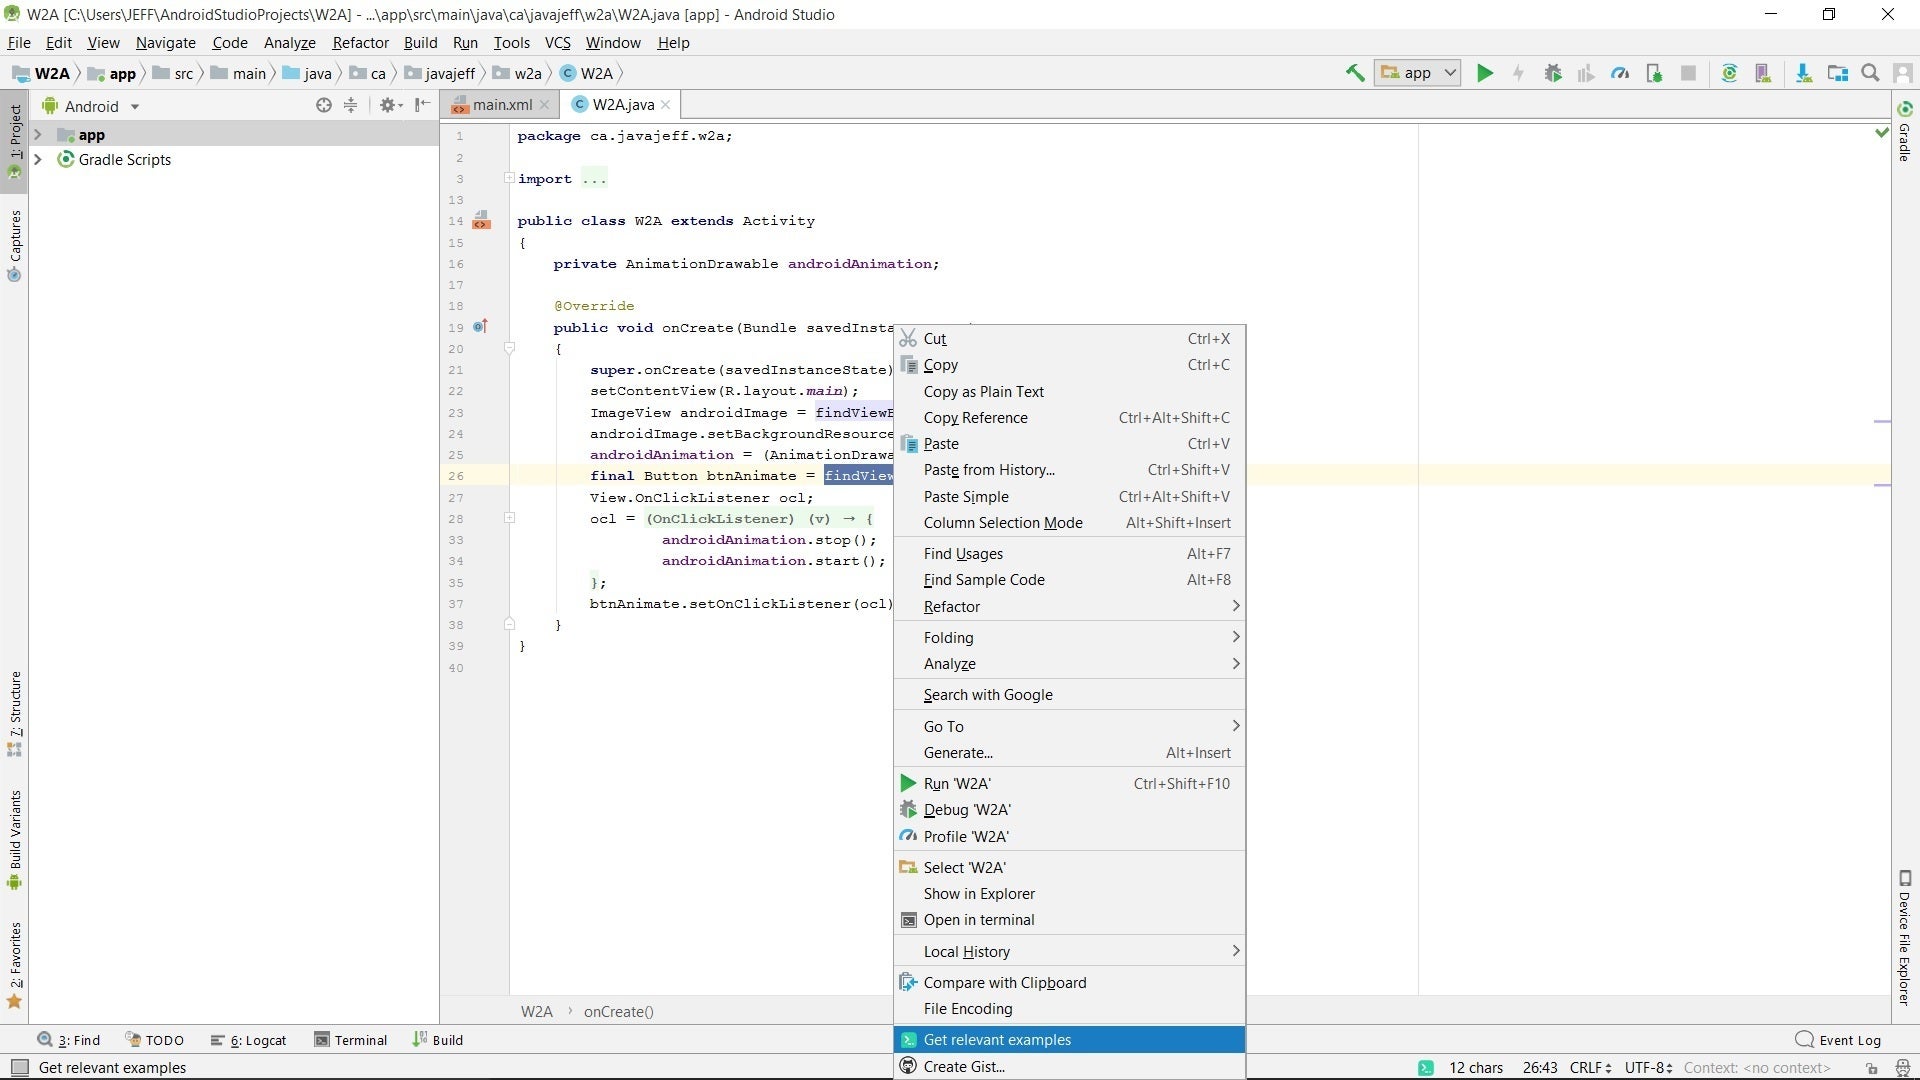
Clicking this menu item results in the browser presenting a page with relevant code examples. For example, the following page presents examples that are relevant to
findViewById: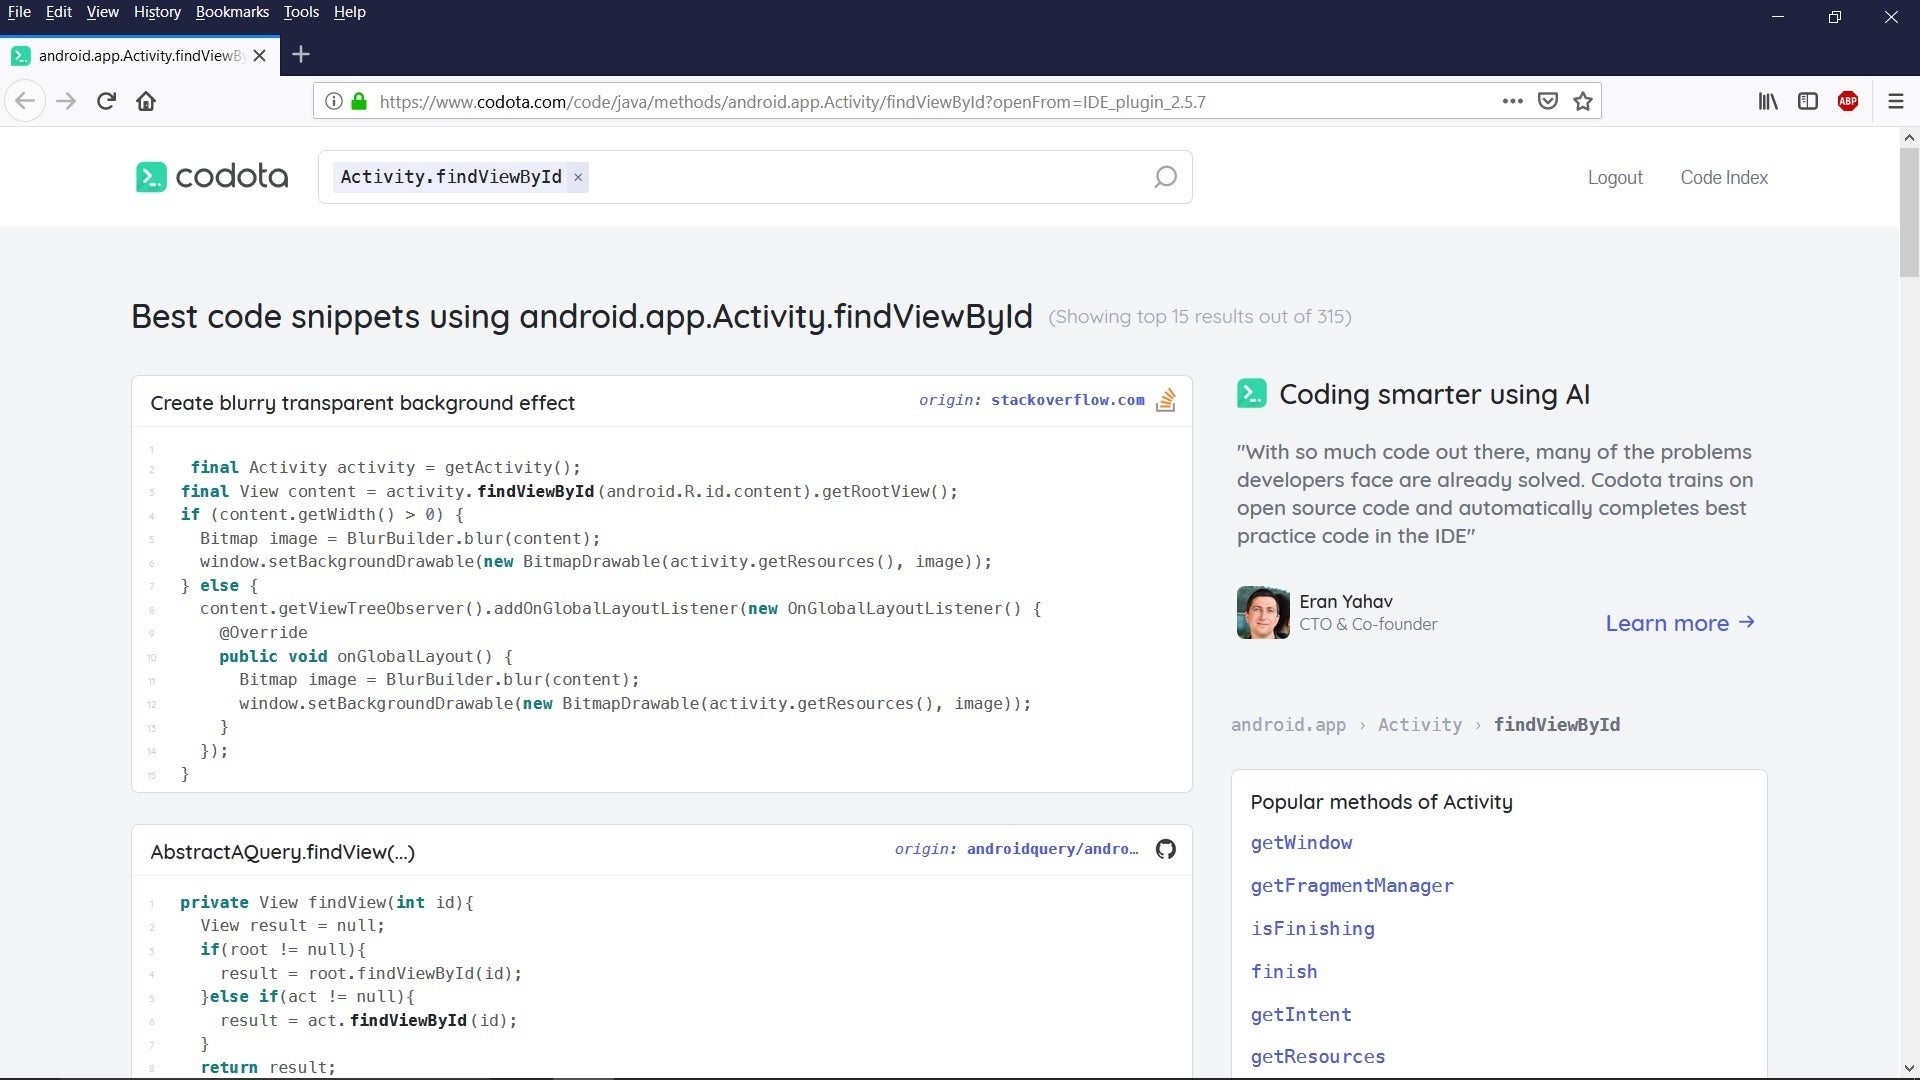
Autogenerate Java code: Lombok
Project Lombok offers a set of annotations that you can use in place of boilerplate code, thus saving you time writing out this code by hand.

Select Lombok Plugin in the repository list of plugins, then click Install. After Android Studio downloads and installs the plugin, it will prompt you to Restart Android Studio. Restarting activates Lombok Plugin.
A simple example will demonstrate Project Lombok's usefulness. Suppose we add the following minimal
Robot class to the example app's W2A.java source file:
The idea with this class is that we'll store the name of the robot being animated and potentially any other information that might be useful, and display this information as a toast (a small message that appears like a tool tip).
We could take a few minutes to add a constructor and getter/setter methods to this code. However, a better option is to let Lombok add this boilerplate for us. Here are the steps:
- Right-click on
Robot. - Select Refactor from the pop-up menu.
- Select Lombok from the next pop-up menu.
- Select Default @Data from the next pop-up menu.
You should now observe an
@lombok.Data annotation prefixed to the class Robot header. This annotation causes the constructor, getter/setter methods, and other boilerplate code to be auto-generated. You can see all of this boilerplate by repeating the previous steps, but this time select Delombok instead of Lombok. You'll see that Lombok has generated something like the following:


0 Comments